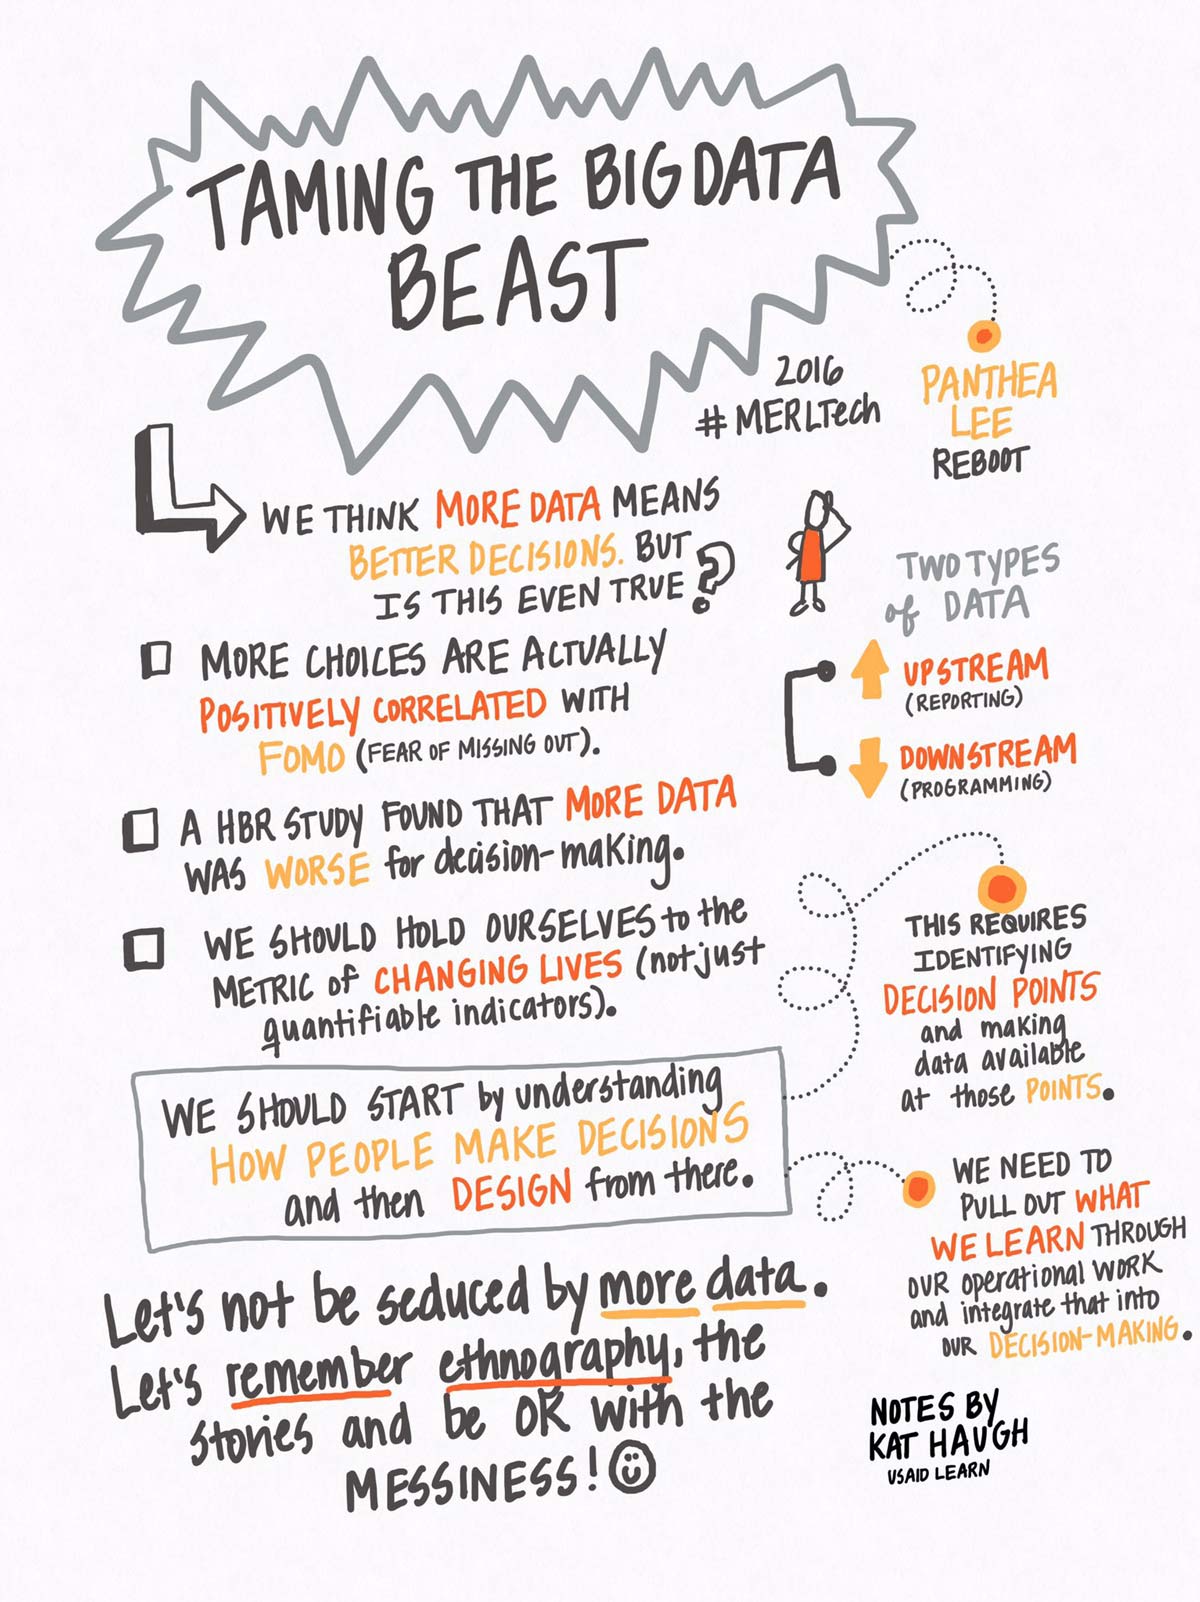
Editor’s Note: Panthea Lee delivered a keynote at MERL Tech in Washington, DC, on October 3. In response to numerous requests from conference attendees, Panthea has adapted her talk to share here. And to kick it off, we are thrilled to share these visual notes from the presentation, recorded by Katherine Haugh on behalf of USAID LEARN:
We’re living in an age awash with data. We generate 2.5 quintillion bytes of data every day. This means that 90 percent of our current data trove was created in the last two years alone.
It’s a wealth of useful information: On a personal level, we can track the steps we take in a day, or trends in flight prices to save money on a vacation. At a sectoral level, we can track rainfall from one farm to the next, or measure subnational economic development from space. When it comes to data, we are spoiled for choice.
But so much of the data that is supposed to help us make better choices seems to have the opposite effect.
We all know that too much choice can paralyze us individually, even with simple decisions (like getting FOMO when deciding on weekend plans). As it turns out, things aren’t much better for organizations. Earlier this year, Fortune reported on a survey of 300 senior executives in 16 countries about their data use. Even in the private sector, with all of the money of the Fortune 500s, “more data” often causes more problems than it solves: Eighty percent of executives said that an important strategic decision had gone “haywire” in the past 3 years because of flawed data.
To many of us working in development, that statistic will sound pretty familiar. Data can bring clarity and insight, but it can also cause paralysis and confusion.
I recently saw an extreme version of data paralysis in the office of a large Presidential Initiative program. I was surprised that for every single program staff member, there were three people fulfilling M&E roles. And the M&E staff were working 60-hour weeks, compared to the standard 40-hour work weeks of the program staff.
This office was responding to an emergency situation; their initial mandate of tracking 50 indicators had ballooned to 150; and the donor was requesting weekly reports. They were fighting the data beast.
The most frustrating part of the situation for the staff was that nobody was reading their reports. Decisions were still being made based on human responses and judgment. Even when their data-gathering efforts uncovered real-time challenges in implementation, procurement barriers usually meant that staff could not respond in a timely manner.
They wondered: Why are we collecting real-time data, when we can’t implement real-time programs?
This is an extreme case, but not an unfamiliar one. In large and small ways, development practitioners have been asking this question for some time. Andrew Natsios, a former USAID administrator, described this situation at a macro scale in his essay “The Clash of the Counter-bureaucracy.” Natsios focuses on the particular challenge that USAID faces in reporting on its work, and defending its value, to Congress.
Natsios describes the perverse incentives that often drive M&E. Congress, which funds USAID, prioritizes the approval of the American people, who don’t really understand the role of global development. And many members of Congress don’t understand development well, either. The pressure to count and comply, to justify program work for the DC audience, is dysfunctional. The counter-bureaucracy essentially ends up encouraging work that can be easily counted.
We run into real problems when we confuse accountability with countability.
Reboot has seen this dynamic in ethnographies we’ve done, studying both development donors and implementers. In practice, we’ve found that the problem of the counter-bureaucracy results in two types of data.
We call the first type of data Downstream Data, or management data. It’s the patient survey data that helps a health clinic administrator understand that her staff have been overcharging patients for medicines. It’s the SMS-based birth registration system that helps the government understand where schools need to be built. It’s the sensors that help farmers know how much water they need to sustain their crops. In short, Downstream Data is useful for adaptive management and can help programs generate impact.
Upstream Data, or reporting data, is mostly for high-level decisionmakers and oversight bodies. It is useful for institutional accountability, strategic planning, and stakeholder coordination—which are all important.
But the fixation on Upstream Data, as represented by the counter-bureaucracy, does tend to conflate countability with impact. When we look closely at how decisionmakers at the highest levels use upstream data, there seems to be a widespread assumption that there’s a correlation between the number of indicators and the magnitude of “development happening.” The more we can measure, this assumption goes, the more impact we’ve had.
As Natsios points out, the opposite is true: “The development programs that are most precisely and easily measured are the least transformational, and those programs that are most transformational are the least measurable.”
The other challenge with Upstream Data is that it’s designed for people who are not close to the issues. To be quickly parsed and understood, data needs to be aggregated, processed, and “success-storied” and meet these audiences’ needs. It is slotted into inflexible indicators, suited to reporting templates, and gathered on donor timelines. In short, Upstream Data has a lot of the context stripped away. So it often doesn’t reflect the dynamic interplay between work on the ground and the data that’s needed to make sense of what’s happening.
But, unfortunately, it’s usually Upstream Data that is the highest priority. It serves the goals of those who have the most power, and it’s connected directly to funding streams. Downstream Data serves beneficiaries who generally wield less power, and the structures for collection are less well-defined.
Implementers recognize the limited utility of Upstream Data for their programmatic work, and know that they need Downstream Data for more adaptive management practices. The structural challenges that prevent implementers from getting the data they need are hugely disempowering; Upstream Data consumes resources and diminishes motivation, ultimately detracting from a program’s ability to pursue good development.
Measurement for the sake of upstream awareness misses the point of development. None of us got into development work because we wanted to track indicators. We want to make people’s lives better. That’s the metric we should hold ourselves to on a daily basis. To make data matter, we have to figure out how it can be used to ultimately serve human needs.
To break out of the counter-bureaucracy, we need to move beyond focusing on the quantity and speed of data. We need to move from collection to processing; to build in more time to understand the implications of data; and to integrate data into decisionmaking.
That time doesn’t fit into neat expectations. Data is inherently messy. It’s a snapshot of information from a specific time and place. There is a lot of narrative and context and meaning that is embedded in data, that need to be drawn out through conversations. We have to understand decisionmaking, and then adapt and present the data to directly support it.
And this is possible! This kind of decisionmaking-driven data-gathering is happening throughout the sector. One example is Reboot’s experience designing our My Voice program.
My Voice began when the World Bank asked Reboot to do a social accountability program to improve the quality of health facilities in Nigeria based on patient feedback. The World Bank was interested in, among many things, a dashboard to understand the feedback. Our first thought, as implementers, was, “Not another dashboard for DC.”
So we worked closely with the World Bank team to think about how social accountability was related directly to impact on the ground. We did it through in-depth ethnographic research with service providers and health officials all along the service delivery chain.
In our pilot, we observed people in facilities, in government offices, and at the state and national primary health care agencies. We worked to figure out what pain points they had—and how the information we could gather could help solve it.

We saw the data beast first hand. For example, we met busy clinic managers who weren’t around to supervise staff, often because they were busy reporting to donors. They knew they were in a bind, and that theyneeded to train staff, but they didn’t know where to start.
We also met health care administrators who were frustrated by the reports they received from clinic managers. They knew the data wasn’t exactly useful, but didn’t have time or money to go to the field to get better information. They knew that donor program suggestions were not always a good fit, but they didn’t have the data to know why.
These were the people with the most power to make a difference in clinic performance, and they were our users. We knew that any solution needed, most importantly, to work for these users. And through testing, we quickly discovered that dashboards weren’t as helpful as printed reports, in-person meetings, and conversations between health officials. They needed a process to interpret the data accurately and use it responsibly.

My Voice is a tech solution, gathering feedback through an SMS tool. But just as importantly, it is also a program. In this pilot, it included weekly management meetings to aid decisionmaking, reports tailored for uses, and an analysis to scale this data up to the national level to advocate for policies that had real impact on people’s well-being. (Read more about My Voice here.) This is hard work. It is time-consuming. And it takes true collaboration, working shoulder-to-shoulder with users and decisionmakers.
Importantly, it also requires working with government. At MERL Tech, I heard a lot of talk about serving communities, and about serving donors. But we didn’t talk much about serving governments. Ultimately, if we’re doing our work right, it is their capability and assets we should be building. They are the ones who will stick around, and who will use data to serve people in the long run.
There’s a silver lining in all of this. For all of the challenges of Upstream Data, it is still data. In our own work, and an ethnography we’ve been conducting at USAID missions, we’re seeing a lot of investments in ICTs and new tools to get Upstream Data faster and cheaper. People are looking to leverage ICTs to work with ambitious targets, migrating to mobile data collection tools, and introducing digital project management platforms to manage the reporting burden or reduce costs. These advancements have implications for Downstream Data.
For one thing, it means that data is getting to a level of frequency and granularity that can have surprising revelations. Some programs, in the process of experimenting with ICTs for their upstream requirements, are “stumbling onto” data they can use downstream. When they find this useful data, some begin using it for adaptive, responsive management.
We saw this in one recent, massive project with the U.S. President’s Emergency Plan for AIDS Relief (PEPFAR). The project was collecting a lot of data about how many people they were testing for HIV/AIDS, and had the idea to take a closer look at the ratio of positive tests to overall tests. They realized that their “hit rate” was low in certain areas, which meant that they were testing in regions where HIV/AIDs was not prevalent. This was a huge realization, and one that allowed them to redirect resources to areas with a higher disease burden.
We also saw this during our elections work in Libya. Our mandate was to build and deploy a mobile voter registration platform (the world’s first!). We ended up doing that—and complementing it with a whole suite of elections management tools. This was because once we started receiving voter registrations, the government realized the value of this data for allocating staff and resources and targeting get-out-the-vote efforts, among other applications.
These are small, discrete examples of people wrangling the data beast and pulling useful Downstream Data out of Upstream reporting streams. And in our research, these “positive deviants” tend to keep going. When program staff see the creative opportunities in data, they start thinking about other questions that can be answered with timely, regular, granular data. Data can become a habit!
But we can’t sit back and hope that this keeps happening. It’s up to us—implementers—to make more space for Downstream Data. The development industry isn’t going to change quickly. So we have to start making these changes ourselves, which sometimes means going beyond the call of duty. It also means working closely with those people within large organizations who are champions for smarter data gathering, to find incremental ways of working differently.
It also means we have to remember to not get seduced by the promise of more data. Technology can be a red herring. We can think that more remote sensors, more citizen reporters, and other innovations that provide more data will solve everything. We have to remember that every data project will come with new needs to understand it.
So when we get excited about new technology and new data, we also have to get excited about the processes, the time, and the conversations we’re going to put into extracting value from the data. We need to remember to do user research to identify pain-points and institutional ethnographies to identify decision-points. And we need to figure out what is important in the data, and then integrate it into our decisionmaking.
Because if we don’t start making these changes soon, we won’t just be awash with data. We’ll drown in it.

